
What We Do
Location
123 Business Street, Suite 456
New York, NY 10001, USA
Contact us
Location


Navigating Q2 2026:
Strategic Positioning in a Shifting Landscape
As we enter the second quarter of 2026, we test and confirm initial strategies and make targeted adjustments as market trends continue to develop.
International markets began the year with strong performance before entering a period of volatility early March. We continue to hold emphasis on the emerging Asian markets outside of China, where pro-growth policy adoption and globalization trends are driving reduced reliance on Chinese supply chains. Recent volatility is a direct result of disruption in key supply channels around the Strait of Hormuz. Economic data suggests a narrow window for stabilization through either negotiations or alternative sourcing strategies for fertilizer and other crude oil derivatives. Inflationary pressures could re-emerge, forcing the banking systems to readjust, slowing regional growth. At this stage, we are maintaining current positioning but monitoring closely.
The “Magnificent 7” trade has lagged the broader S&P 493, with significant volatility. Capital is rotating toward AI support roles and non-defense industrials. While Capital expenditures tied to AI continue to trend upward, with no clear ROI projections, putting downward pressure on the big names.
Deglobalization continues as a key theme in 2026. Onshore manufacturing and revenue expectations continue to grow, as industrials and energy companies are implementing AI systems to do more with less. This trend continues to grow into the broader expansion phase.
The US consumer remains resilient. Default rates are stable, and sentiment continues to trend upwards. The unemployment rate has trended slightly upwards, yet remains stable and at relatively low levels. Supporting overall economic stability in 2026.
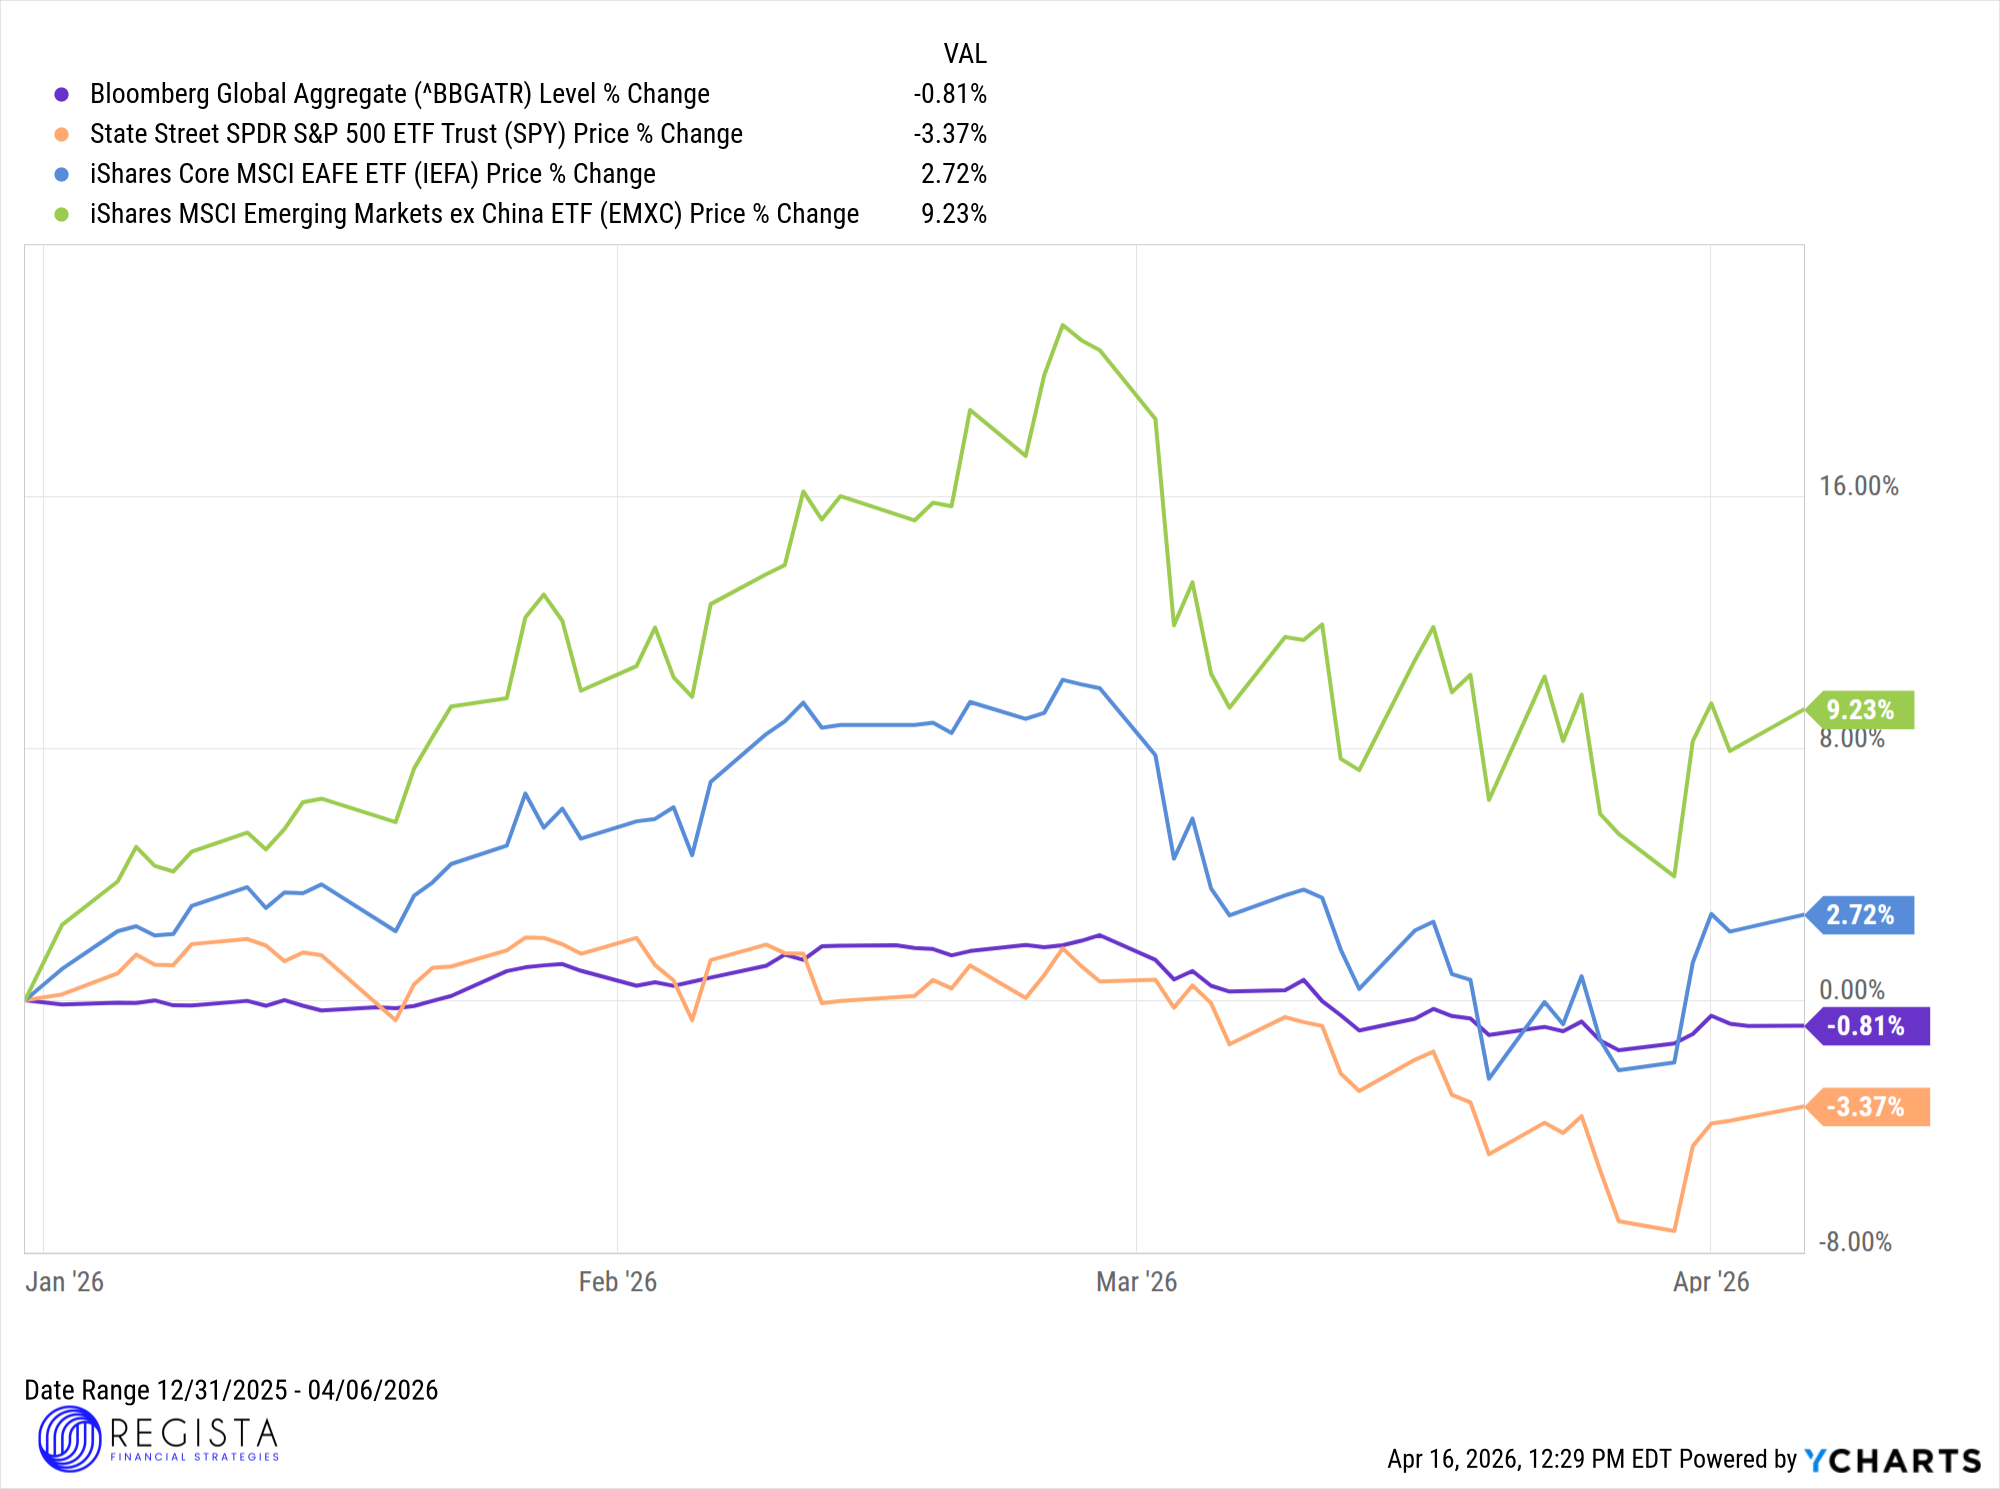
* The following chart highlights returns (as of April 6th) across major global markets using representative ETFs. It includes Global bonds (Bloomberg Global Aggregate, in purple), The S&P 500 (State Street SPDR, in orange), Developed international markets (iShares Core MSCI EAFE, in blue), and Emerging markets excluding China (iShares MSCI Emerging Market ex Chine, in green).
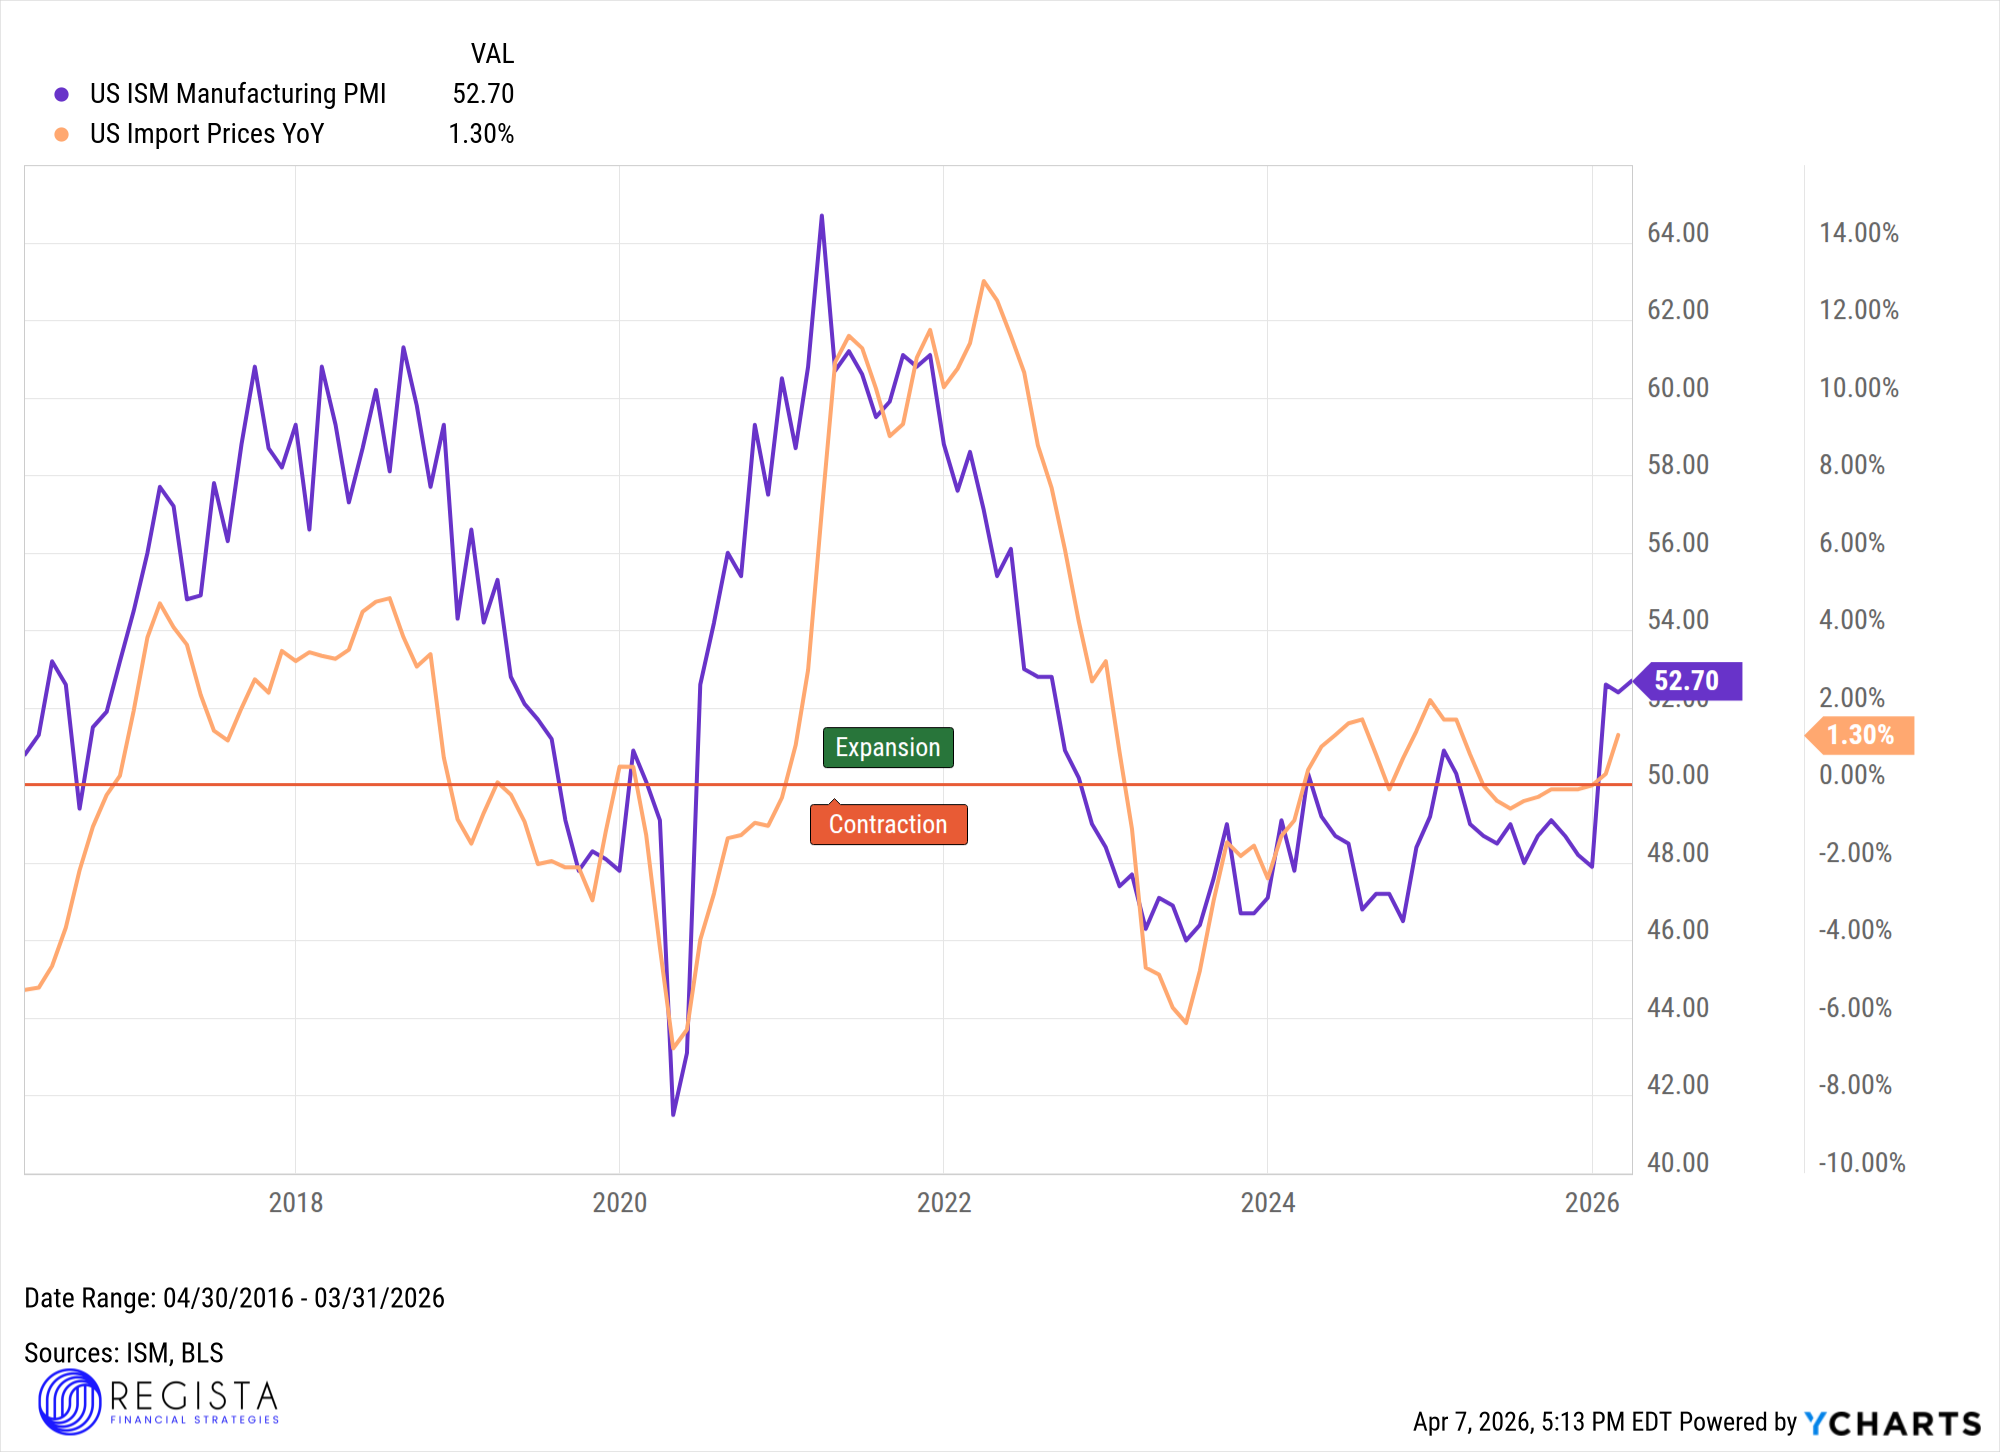
Our focus remains on disciplined risk-taking and proactive rebalancing as market conditions evolve. Over the past two months, we have taken profits in portions of international exposure while maintaining an overweight position in industrials. U.S. Manufacturing data continues to support this theme, with strong readings across orders, shipments, and manufacturing PMI indicating ongoing expansion.
* The following chart shows U.S. manufacturing entering the expansion phase in 2026.
Within fixed income, we maintain an overweight to mortgage-backed securities (MBS) and select structured assets. Current yields remain attractive relative to the underlying assets values. For these positions to face material stress, a substantial decline in housing prices would likely be required. Given the appreciation in home values over the past five years, combined with favorable loan-to-value ratios among seasoned loan holders, this allocation provides both higher yield and diversification benefits due to its lower correlation with other investments.
Additionally, the bond allocation includes a mix of U.S. treasuries and municipal securities. We remain significantly underweight corporate credit, particularly within segments exposed to elevated risk. Until there is greater clarity on return from AI-related capital expenditures, we believe risk-adjusted opportunities are more compelling elsewhere.
We also continue to diversify internationally within fixed income. Targeting countries implementing pro-growth fiscal policies aligned with deglobalization initiatives.
We are keeping a close eye on inflation, particularly due to sustained elevated crude oil prices. To help manage potential interest rate volatility, we proactively reduced how much a bond’s price or value is expected to move if interest rates change (lowered duration) to better manage interest rate risk.
Crude oil remains one of the most systemically important commodities in the global economy, not simply as a fuel source, but as a foundational input across industrial production, agriculture, and manufacturing. While commonly associated with gasoline and energy costs, the economic significance of crude oil extends far beyond the consumer-facing price at the pump.
At its core, crude oil functions as a base input into a wide range of derivative products that underpin modern economic activity. These include:
Interesting fact: One-third of the world's fertilizer passes through the Strait of Hormuz primarily supplying South Asian countries such as India and several African countries.
This broad integration means that crude oil pricing directly influences production costs across multiple sectors simultaneously. As a result, fluctuations in oil prices propagate through supply chains, creating second- and third-order inflationary effects that extend well beyond energy.
From a macroeconomic standpoint, research from institutions such as the Federal Reserve, IMF, and World Bank consistently shows that oil price shocks are a key driver of both headline and core inflation. More importantly, it is the persistence of elevated prices—not just short-term spikes—that creates broader economic strain. Higher crude prices increase input costs for businesses, compress margins, and ultimately lead to higher prices for end consumers.
There is broad institutional consensus that crude oil operates within a functional equilibrium range, where both producers and consumers can operate efficiently without destabilizing growth. While this range is dynamic and influenced by production costs, fiscal policy, and geopolitical factors, current estimates generally place this equilibrium in the ~$60 to $85 per barrel range:
When crude oil prices remain elevated beyond this upper threshold, the effects become increasingly restrictive. Higher input costs ripple through transportation, manufacturing, and agriculture, contributing to broader inflationary pressure. Central banks often respond by maintaining tighter monetary policy for longer, which in turn slows economic activity.
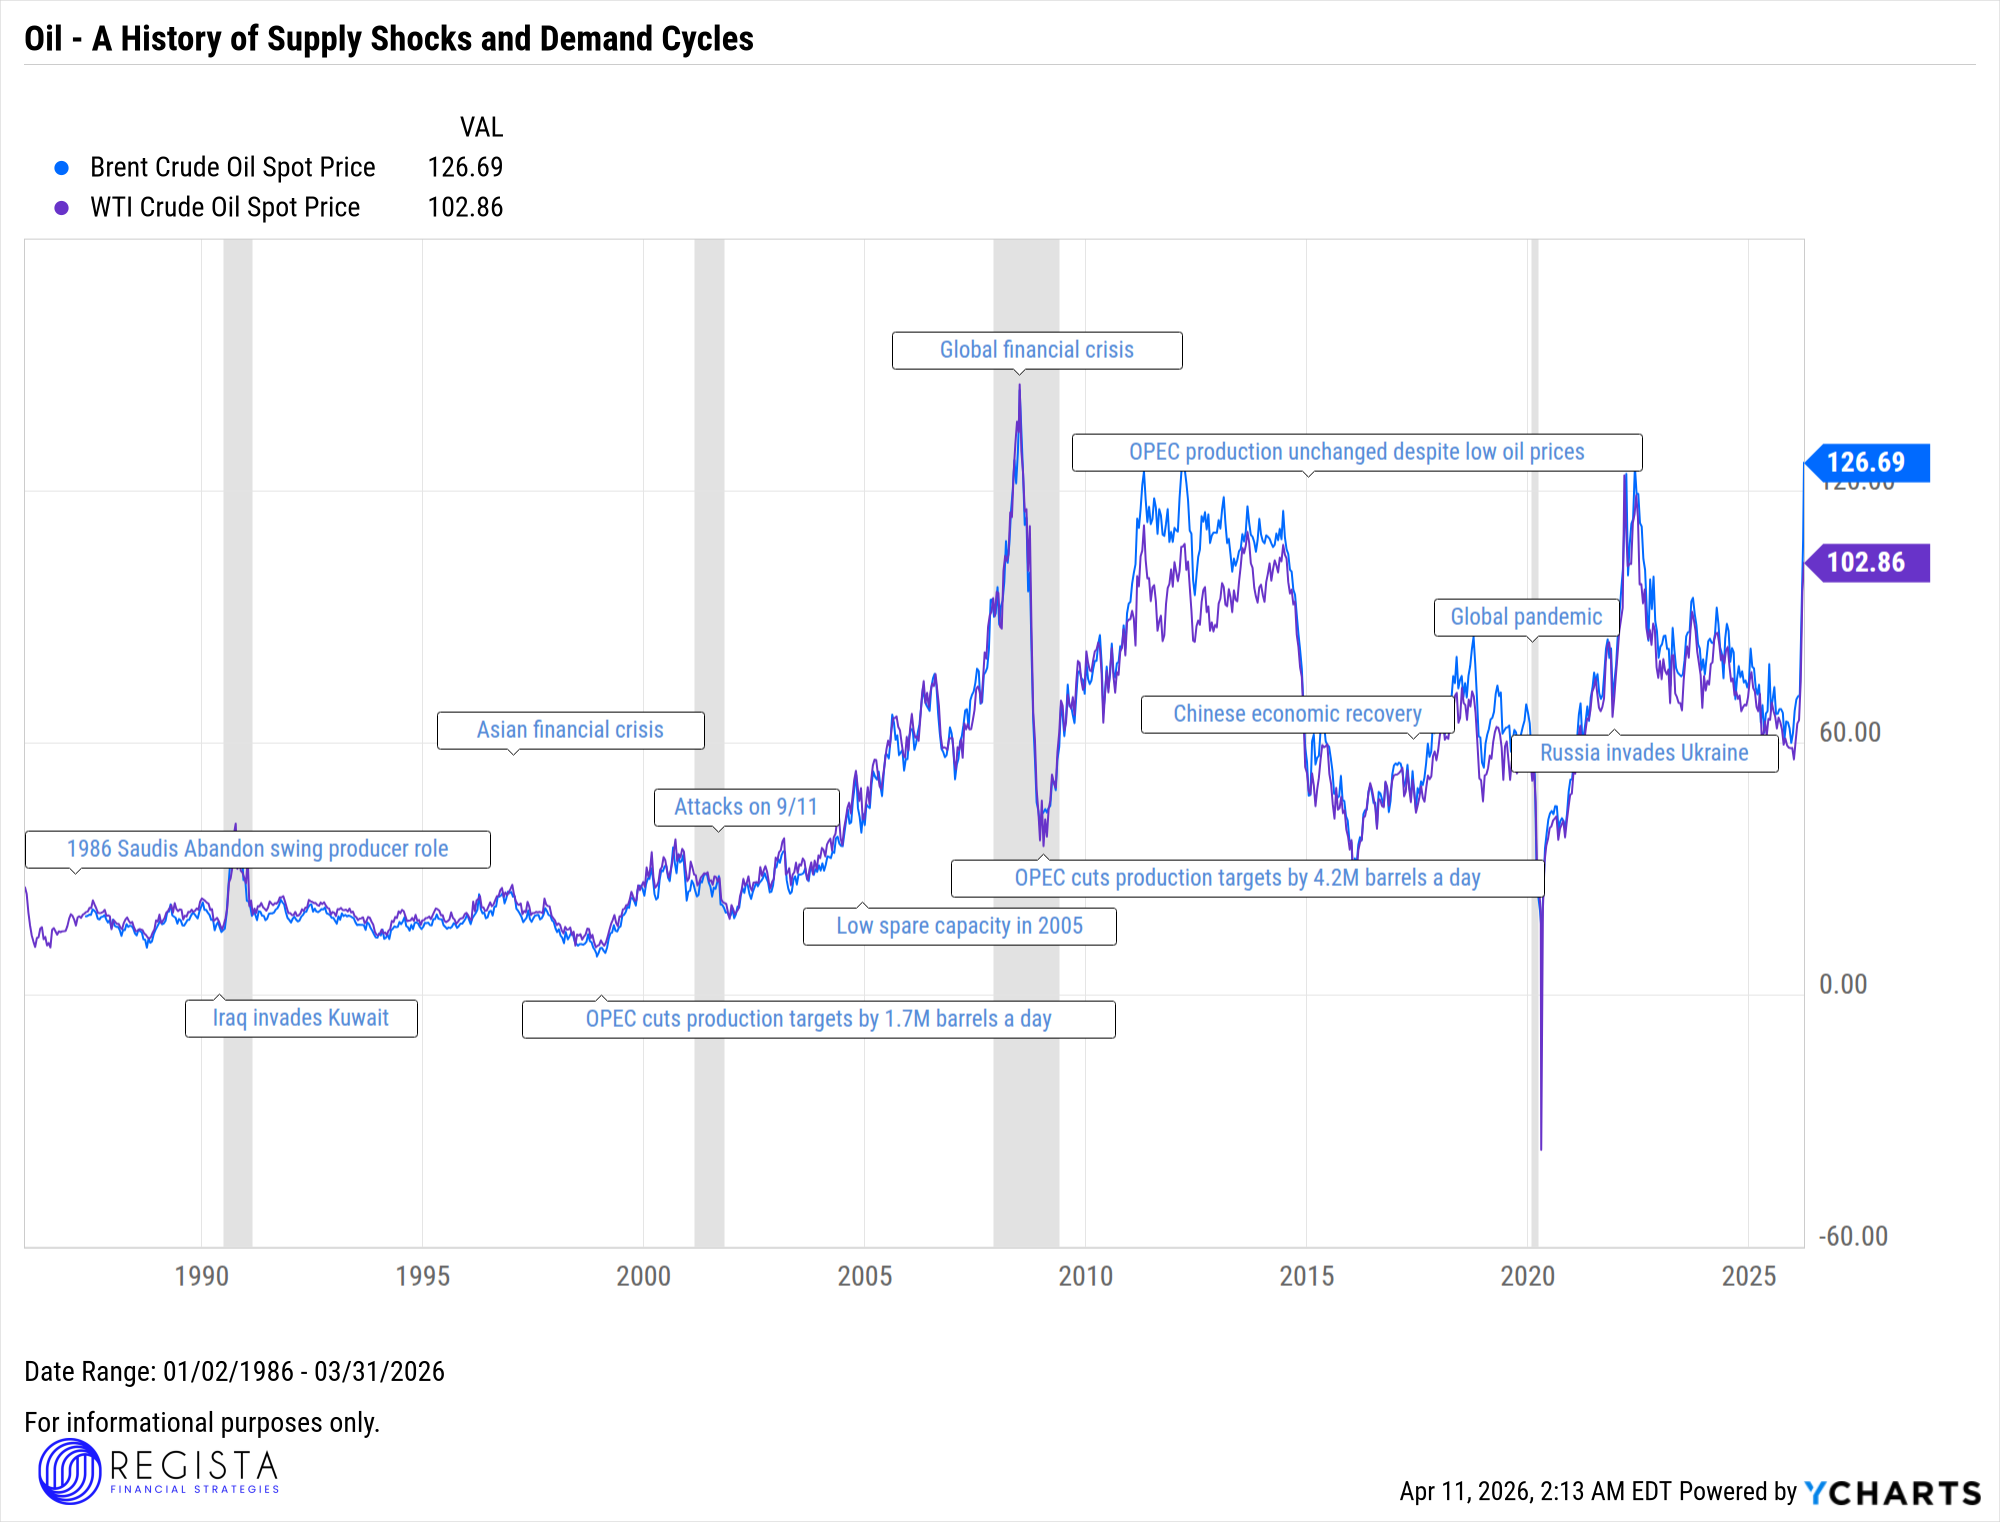
* The following chart shows how major global events have influenced crude oil prices over time. The grey bars represent U.S. economic recessions. Over the past several decades oil prices moved sharply in response to both supply disruptions and changes in global demand. Whether it's coming from OPEC decisions, geopolitical events, or periods of economic expansion and recovery.
Ultimately, stable crude oil pricing supports balanced economic expansion, while prolonged deviations—particularly to the upside—introduce inflationary pressure, policy uncertainty, and increased market volatility. Given oil’s extensive role across both energy and non-energy applications, its impact on portfolios is both direct and indirect, influencing everything from sector performance to fixed income positioning.
As always, we’re here to help you stay focused on what matters most and navigate whatever the markets bring next.

I have had the privilege of working with Akram for several years, and I can confidently say that my financial journey has been nothing short of exceptional. He actively monitors your investments, ensuring they continue to align with your goals.
I can't emphasize enough how grateful I am to have Akram and Regista Financial Strategies by my side in my financial journey.
For nearly seven years, Akram has been the guiding force behind my family's financial success. His expert financial advice and meticulous planning have consistently placed us on the right path toward our goals.
We couldn't be more grateful for his expertise and support. We look forward to many more years of his invaluable guidance.
Going through a divorce after 19 years of marriage meant that finances were deeply entangled. I needed clear, sound advice on where and how to move my funds as they slowly became unknotted from my ex.
Akram was there the whole time to help me understand where everything needed to go in the smartest way possible.

Testimonials were provided by current clients of Regista Financial Strategies, LLC. Clients have not been paid for their testimonial and there are no material conflicts of interest that would affect the given testimonials. These testimonials may not be representative of the experiences of other clients, and do not provide a guarantee of future performance success and similar services.